Recently Microsoft introduced integration capabilities for Dynamics NAV with Azure Machine Learning to make cash and inventory forecasts. This post will walk through the steps to setup the integration in a CRONUS Australia database.
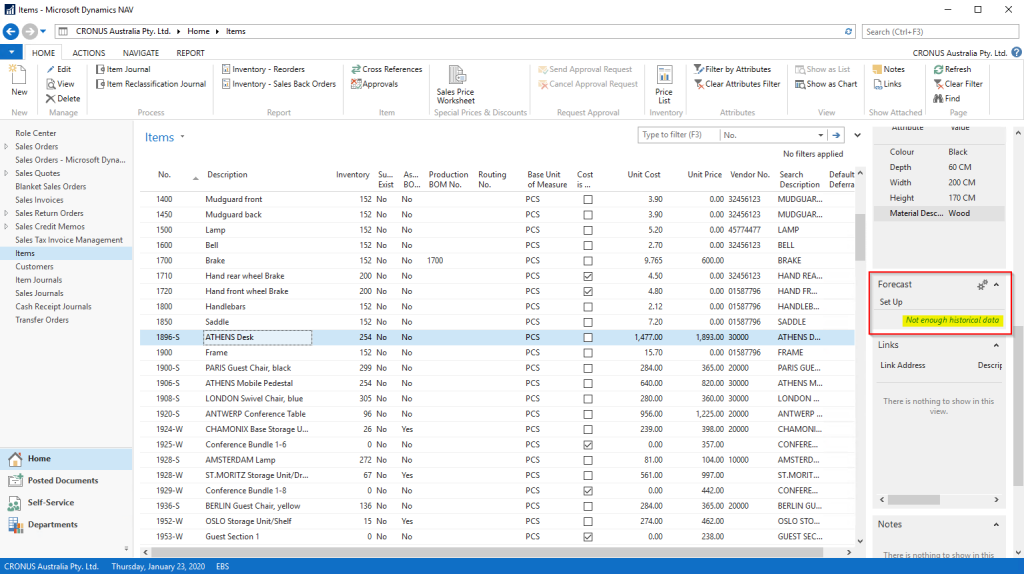
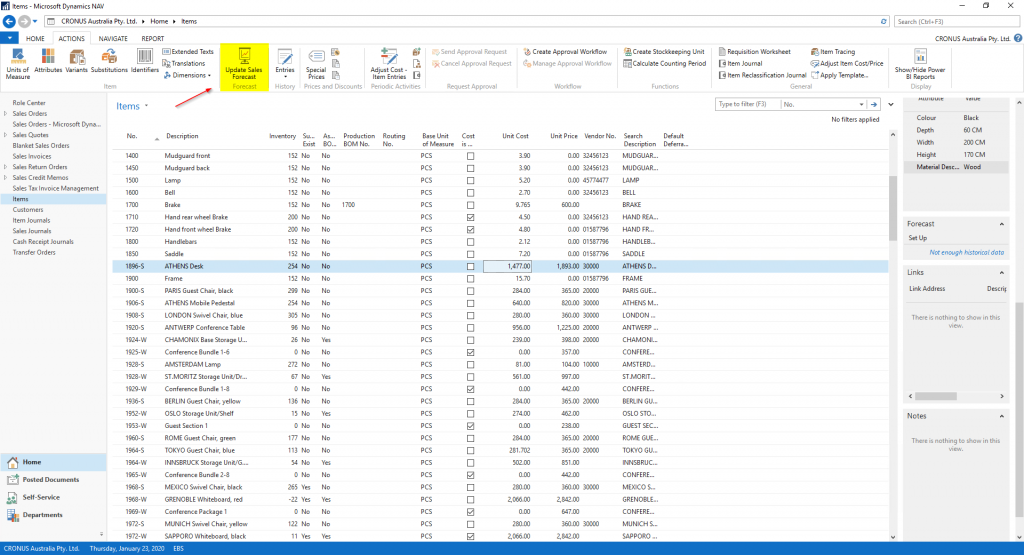
If you select an Item on the NAV Item list and look at the Forecast fact box you would see a message saying, ‘Not enough historical data’. This message is a bit misleading and can also appear in case the machine learning setup is not completed.
This post would show the steps to setup Azure Machine Learning in ‘Dynamics NAV 2018’ but the setup in ‘Dynamics 365 Business Central’ are the same and you should be able to use this tutorial to set it up in your ‘Dynamics 365 Business Central’.
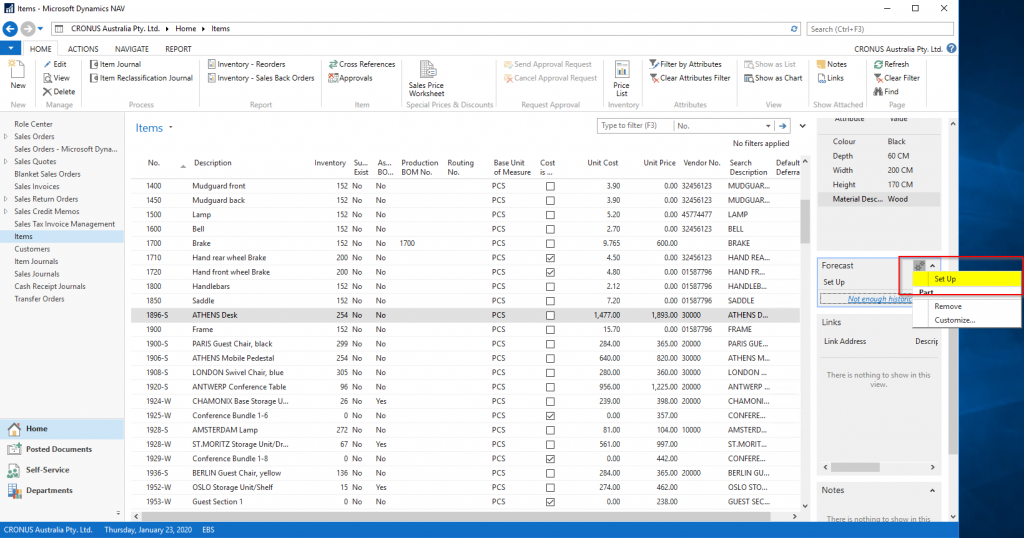
Step 1
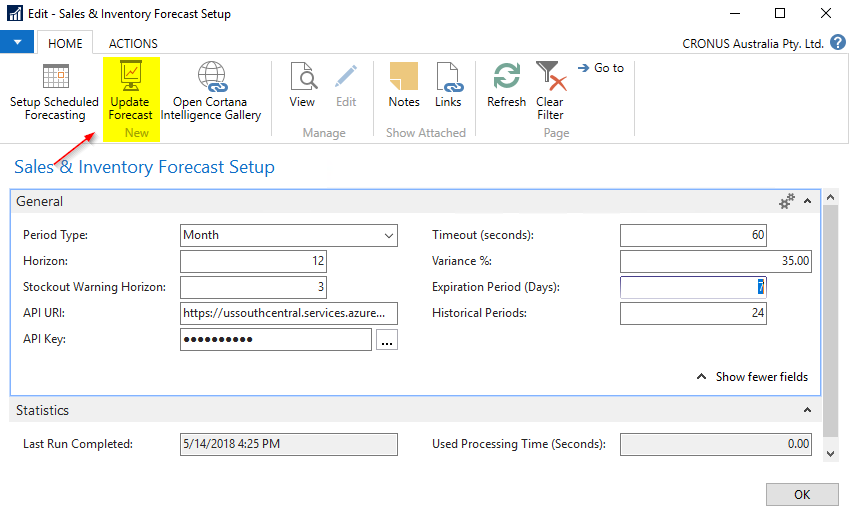
To setup the connection, click the action button and then click setup.
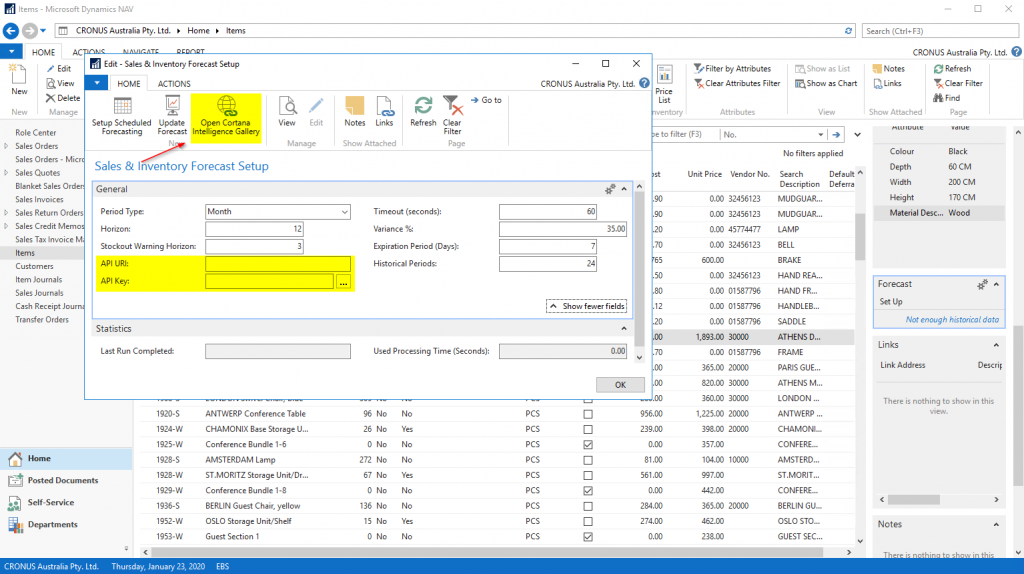
On the setup screens you need the API URI and API Key to make the connection, in the CRONUS installation these are not filled in as these will be unique to each installation. To set it up, click on the ‘Open Cortana Intelligence Gallery’ button on the ribbon.
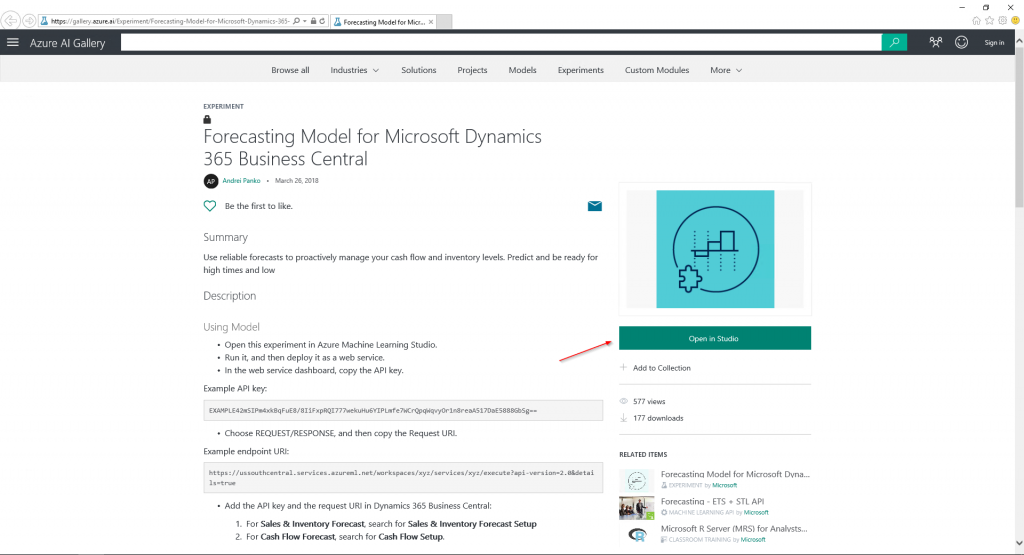
Step 2
This will open up the ‘Forecasting Model for Microsoft Dynamics 365 Business Central’ experiment page. This page provides some information about the experiment and how to set it up.
Click on the ‘Open in Studio’ button.
Step 3
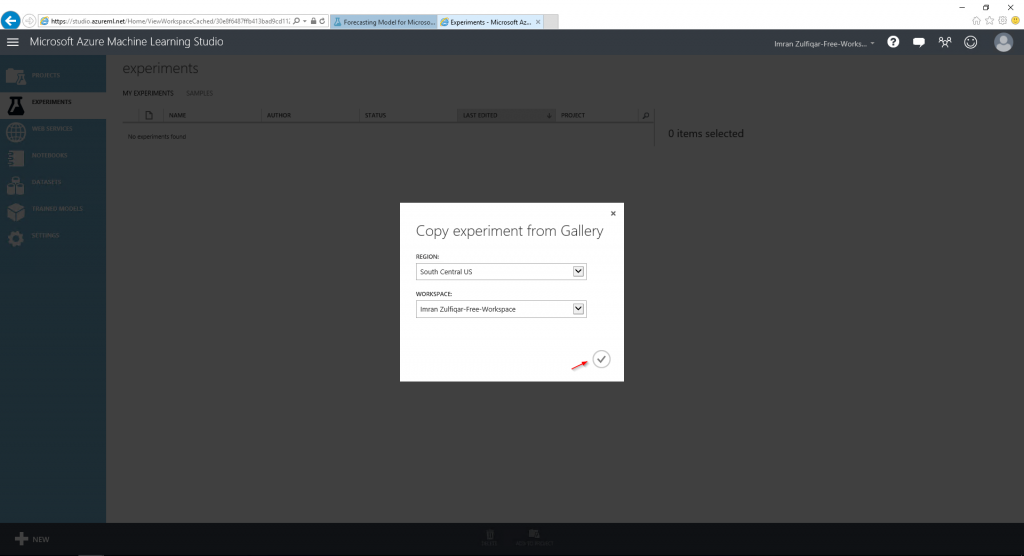
This will require an Azure account, If you do not have an account you can create an account and login. This would give you access to a Free Tier of Microsoft Machine Learning. Once logged in you will be prompted to copy the experiment form the Gallery click the OK button to complete the copy function.
Step 4
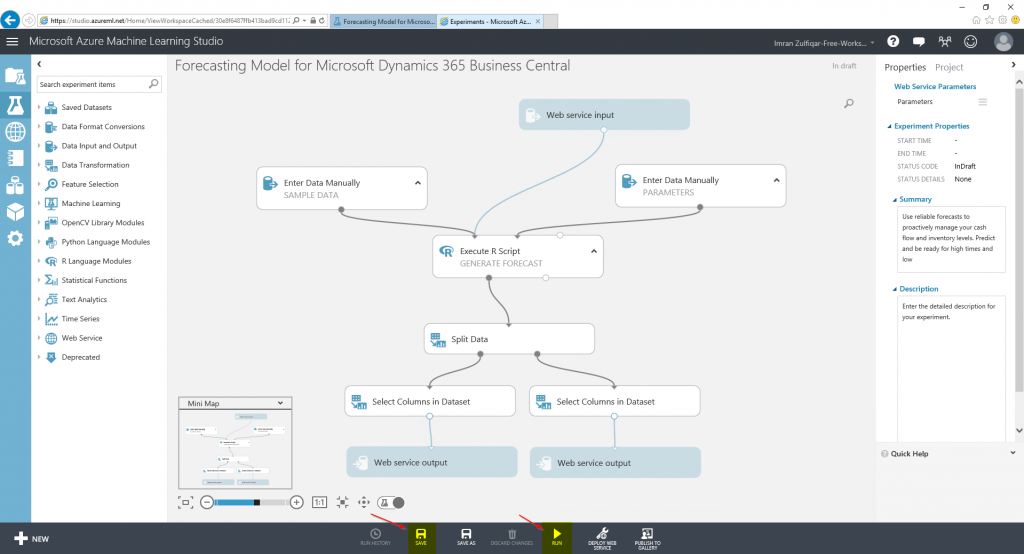
This will copy and the load the experiment in your workspace. This is the forecasting model that NAV would connect to every time it needs to run the forecasting and would display the results from the model to the NAV user. This is obviously the default version created by Microsoft. This is generally good enough for most cases but if it does not suit your needs, you can enhance and make changes to the experiment. For the purpose of this post we will use the model as it is.
Once the model is loaded you should ‘Save’ and then ‘Run’ the experiment.
Step 5
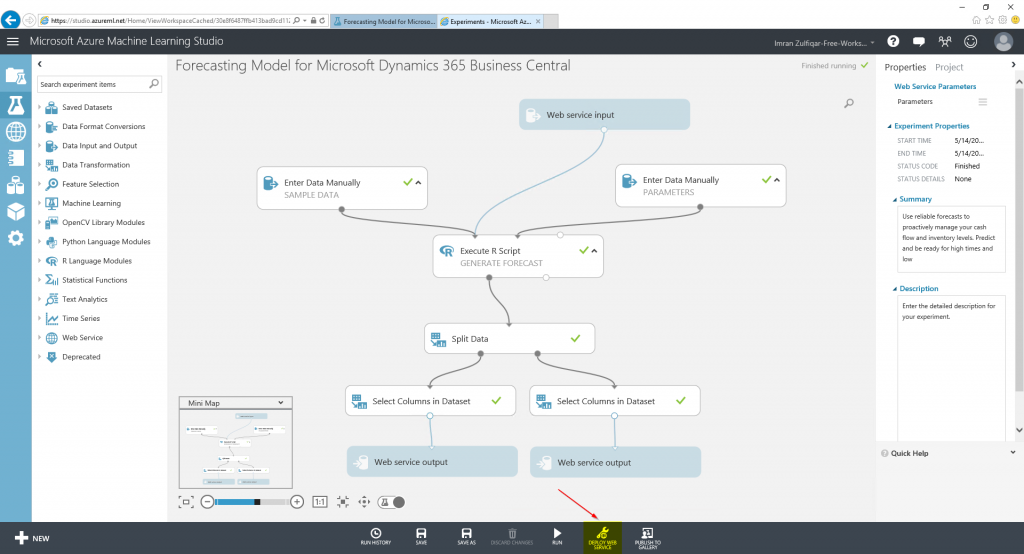
This will take a few seconds and you should see the ‘Finished Running’ message on the top right and little green ticks on each step to show that it has been executed. Once that’s done you can click on the ‘Deploy Web Service’ button to deploy the experiment in your workspace.
Step 6
The next page will give you the API Key. Copy and paste this into your Dynamics NAV Sales & Inventory Forecast Setup screen we open earlier.
Step 7
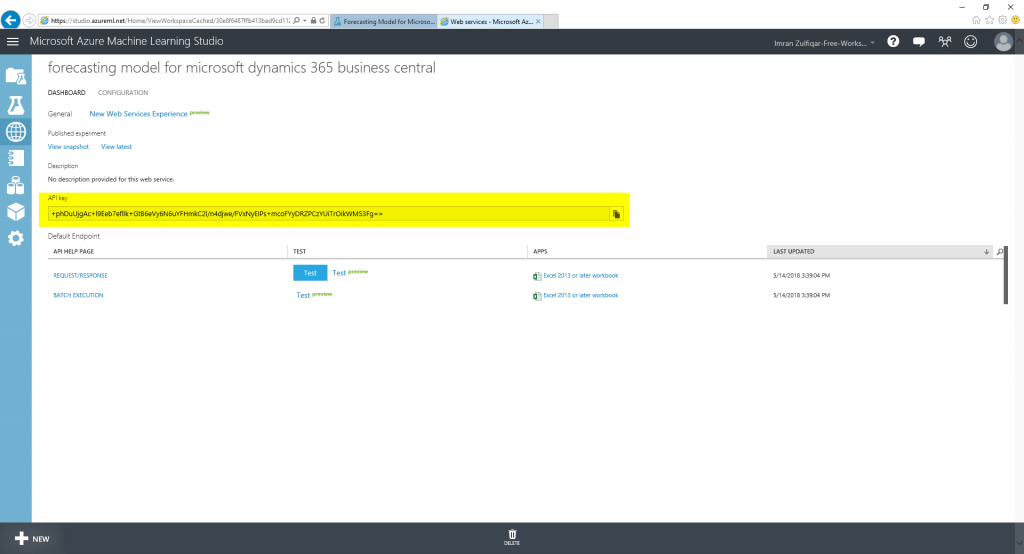
To get the API URI click on the REQUEST/RESPONSE link under Default Endpoints.
Step 8
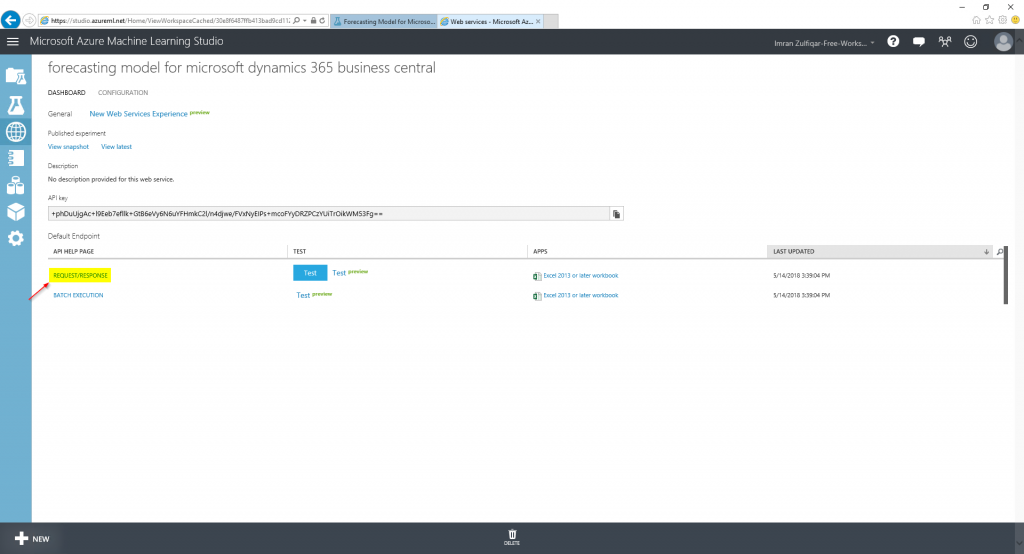
This will open yet another browser window. This is the API end point. Copy the Request URL from the Request section to the Sales & Inventory Forecast Setup.
Going back to the NAV screen, once we have our API connection configured, we can click the Update Forecast button on the Sales & Inventory Forecast Setup to finalise the setup.
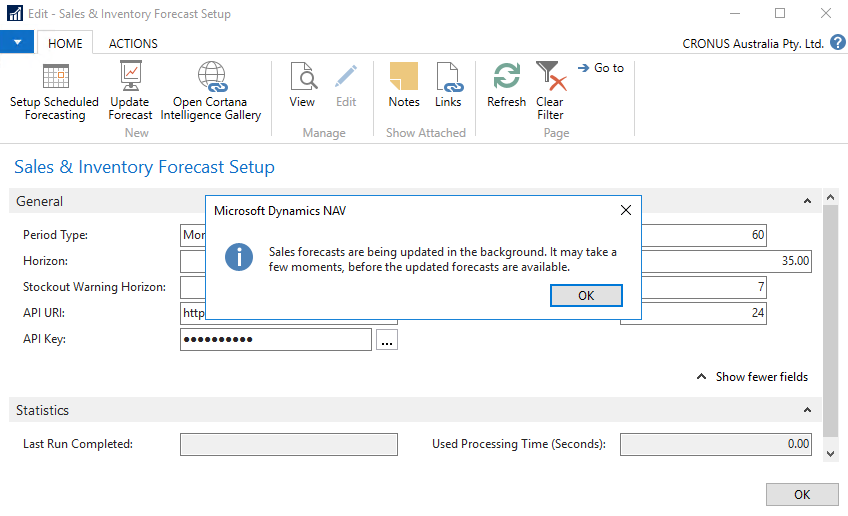
Step 9
NAV updates the data in the back ground so you will see a message saying the forecast is being updated it the background and it may take a few minutes before the function is available.
Step 10
Close the setup and on the item list, go to Actions and click on Update Sales Forecast button on the ribbon. This would update the forecast for this item.
Note that you should have at least 5 periods of historical sales in order to predict the future sales. For this example to work I simply posted an item journal with some purchase in sales lines in the last five periods.
Step 11
It will take a few seconds and provided you have enough data to predict the sales, you should see a graph in the forecast fact box.
Step 12
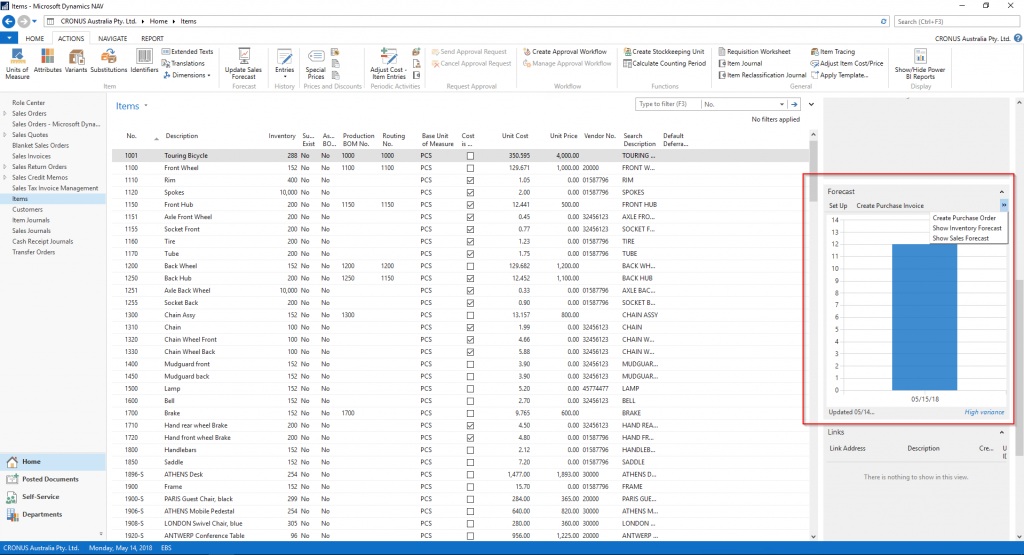
You can look at inventory and sales forecasts. Additionally, you can create purchase document form the fact box directly.
Was this article helpful?

This post was written by Jonathan Martin, COO at Evolution Business Systems.
His expertise extends to software development, support, implementations and project management, he can envisage potential problems and identify them to improve the client experience and outcomes, like a mad scientist, behaviour, statistics and data are where he gets his insights from and lives by a golden rule to always start at the beginning as there are no shortcuts. Jonathan’s passion is to make a difference by assisting clients with their business problems.